The “Assess my Data” page
On this page we provide a feature for feedback on individual data DOIs based on automated evaluation results using F-UJI. Scientists or data professionals interested in concrete feedback on a specific data publication can view the test results and, for each aspect of FAIR, digest general recommendations on how to improve the FAIRness of the data.
Page Components
Search component
The search component allows users to enter the data DOI and evaluate the data, as shown in the following figure.

Info and Charts components
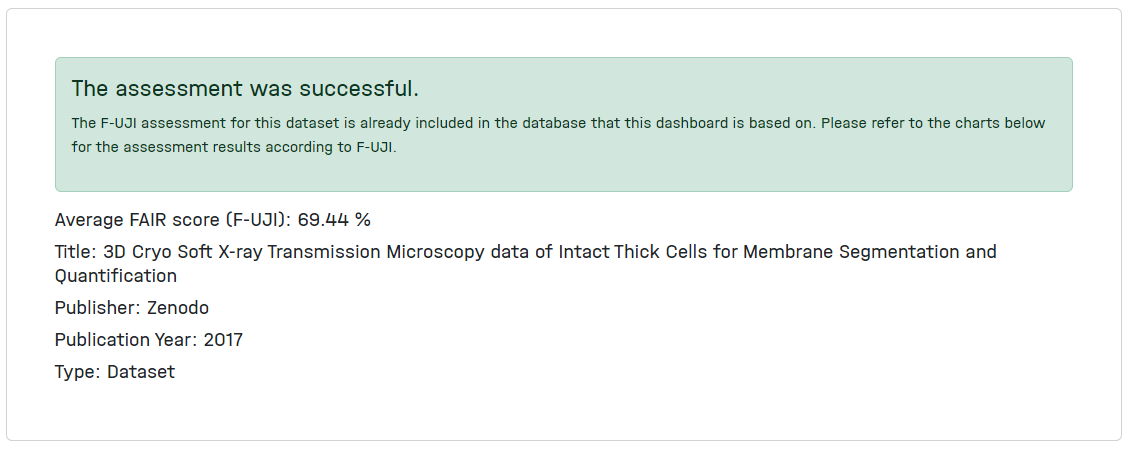
The current page consists of a descriptive info section, five charts and four detailed recommendations to improve the FAIRness score for the given data publication, each designed with a specific target user and object in mind.
- Descriptive info box
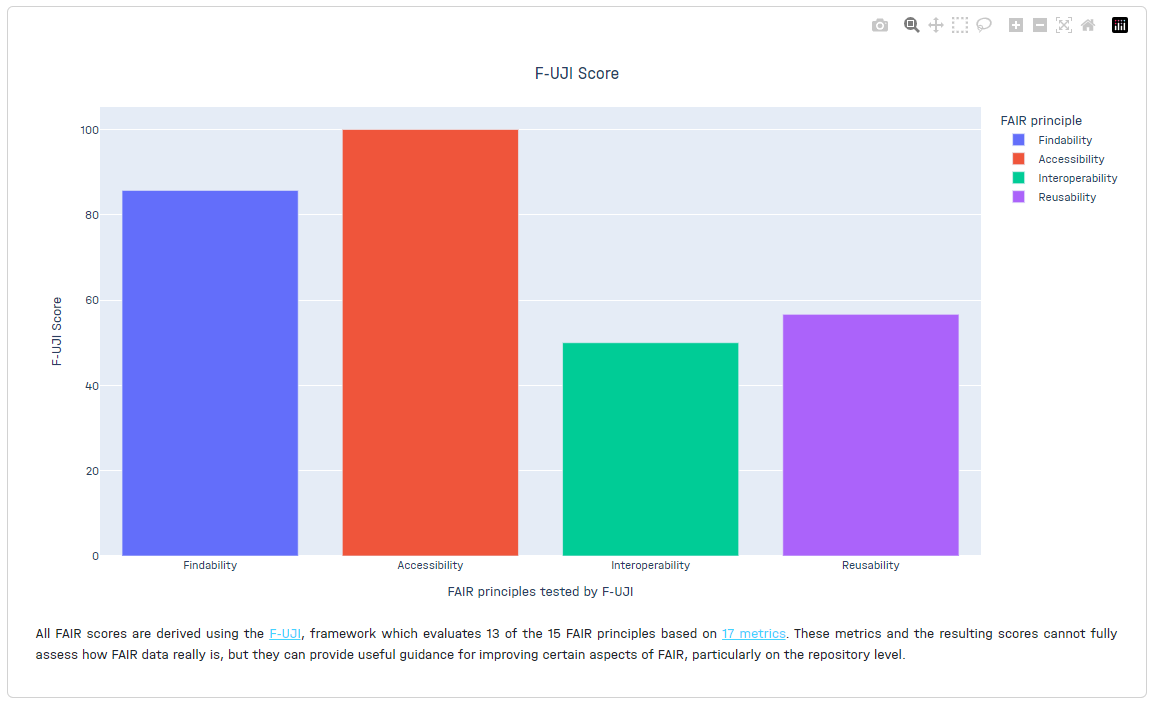
- F-UJI scores as general
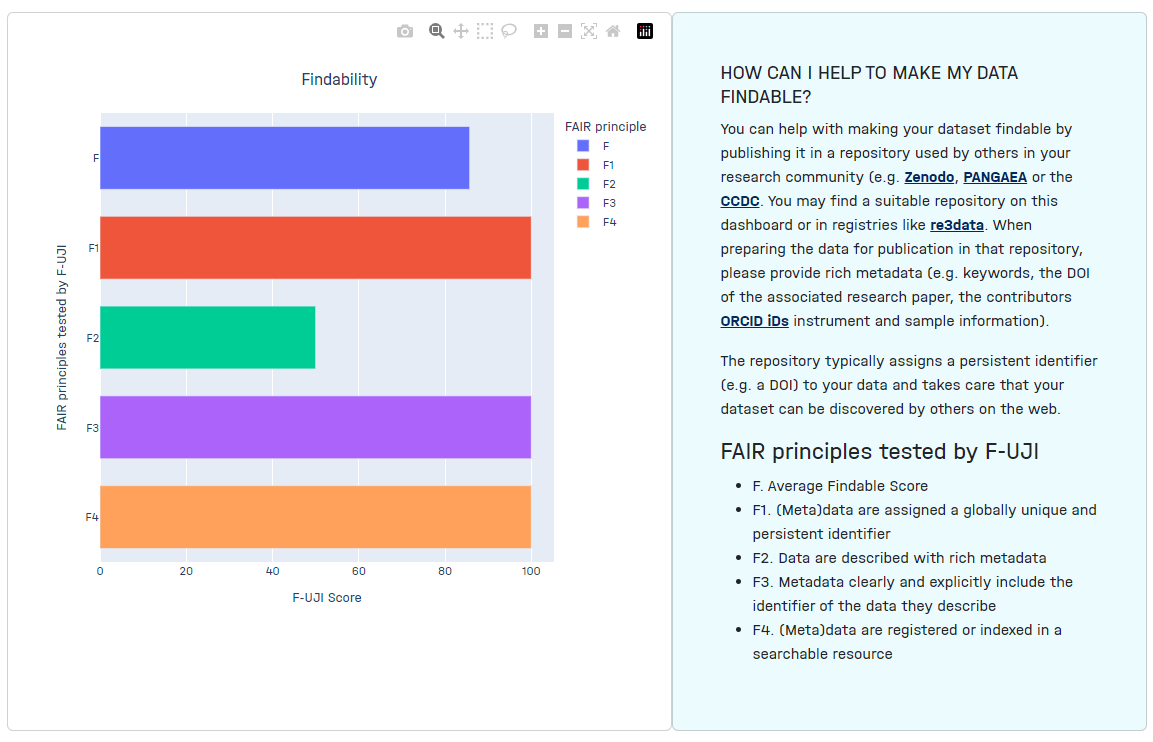
- Findable with details
- Accessible with details
- Interoperable with details
- Reusable with details

Directories and files
In regard to the aforementioned page, all relevant directories and files can be found in the following locations:
- bottom_info_box.py
- charts.py
- filter_options.py
- datacite_info.py
- fuji_conf.py
- fuji_scorer.py
- scholix_info.py
- db.py
- helper.py
- assess_my_data.py
- my_data.de.yml
- my_data.en.yml
Challenges we faced
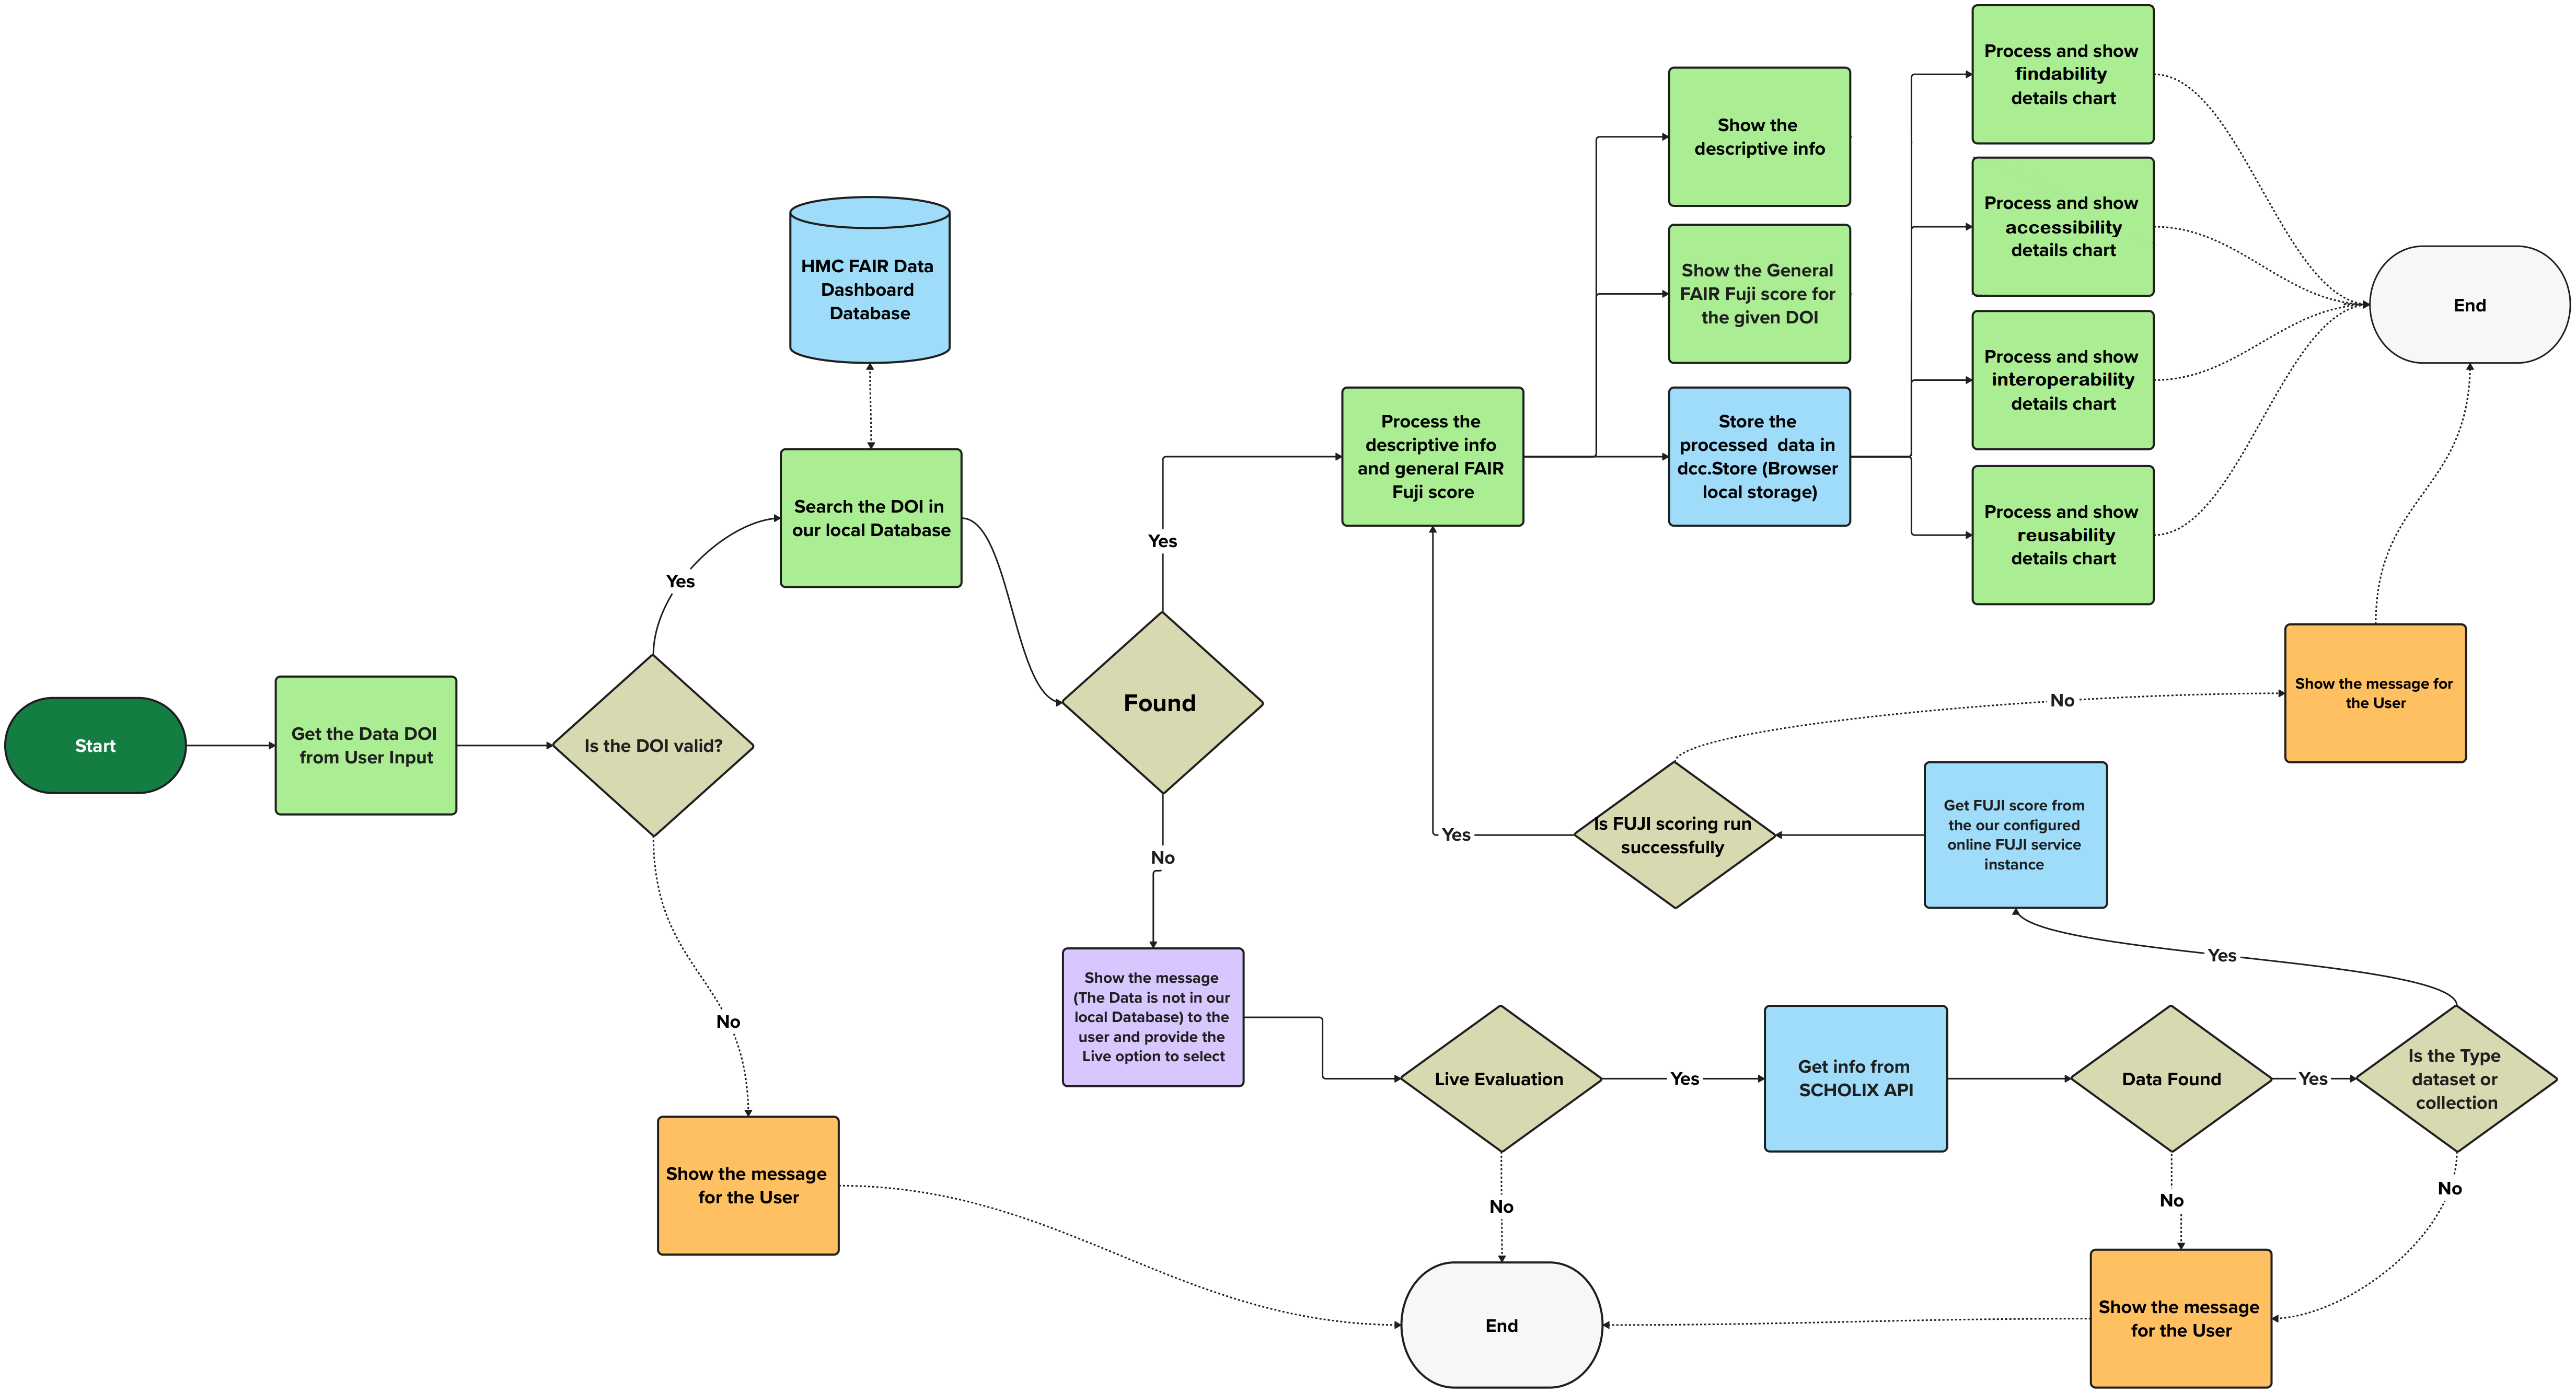
User testing pointed us to the possibility to enter invalid DOIs or to enter DOIs of literature publications into the input field. Since these are neither the scope of F-UJI nor of this subpage, we implemented concrete tests to exclude these exceptions when a DOI is entered.
A diagram of the full decision tree is shown in the following.
Activity flow of the page
The subsequent image illustrates the activity flow of the subpage ‘Assess My Data’.
Page data flow
The following four steps are currently being implemented in a generalised manner for this page.
- Query the data by each change in the user input box (Data DOI) through dash callback
- Process the page charts and info if the data is available in our local Database
- Process the data gathering by means of SCHOLIX and Online FUJI service (Live Assessment)
- Return the process charts and info to update the user interface (UI)
The following section presents a comprehensive overview of the essential steps for plots in this page.
Query the data by each change in the user input box (Data DOI) through dash callback
This page contains three callback functions, reflecting the potential occurrence of two distinct sets of dynamic events.
- Entering the new DOI
- Live assessment if applicable
- Switching the FAIR with details
A callback will be automatically triggered by Plotly Dash upon the loading of each page (at startup) or upon the occurrence of any alterations to the data in question.
    @callback(
    Output("intermediate_value", "data", allow_duplicate=True),
    Output("my_data", "children", allow_duplicate=True),
    Input("search_btn", "n_clicks"),
    State("input_on_submit", "value"),
    prevent_initial_call=True,
    )
    def get_clean_data_per_pid(\_btn, value):
... @callback(
Output("intermediate_value", "data", allow_duplicate=True),
Output("my_data", "children", allow_duplicate=True),
Input("go_live_btn", "n_clicks"),
State("input_on_submit", "value"),
prevent_initial_call=True,
)
def process_live_assessment(n_clicks, value):
...
    @callback(
    Output("graph_details_graph", "children"),
    Input("intermediate_value", "data"),
    Input("assess_my_data_fair_mode", "value"),

)
def update_details_graph(stored_data, fair_mode):
...
2. Process the page charts and info if the data is available in our local Database
In order to query the data from the database according to a Digital Object Identifier (DOI), a function had already been defined and made available for use with the DOI as the argument.
    def get_dataframe_per_doi(doi):
        with db_cursor() as cursor:
            cursor.execute(SELECT_DATASET_PUBLICATION_BY_DOI_QUERY, doi)
            data = _format_fuji_results(cursor.fetchall())

        dataframe = pd.DataFrame(data)

        if dataframe.empty:
            print("DOI not found in database!")
            return False, dataframe

        print("DOI found in database!")
        return True, dataframe
3. Process the data gathering by means of SCHOLIX and Online FUJI service (Live Assessment)
The procedure of the live assessment is as follows:
    info = get_scholix_info(value)
    if info is None:
        ...
    elif "dataset" == info["Type"] or "collection" == info["Type"]:

        data_df = get_fuji_score(value, 1, info)
        if data_df is not None:
            ...
    else:
        ...
4. Return the process charts and info to update the user interface (UI)
Ultimately, the results of each function must be returned from the callbacks in order to facilitate the updating of the UI of each chart in accordance with the desired specifications.
return get_my_data(value, False)
if fair_mode == "f":
    return f_chart(dataset)
if fair_mode == "a":
    return a_chart(dataset)
if fair_mode == "i":
    return i_chart(dataset)
if fair_mode == "r":
return r_chart(dataset) return get_my_data(value, True)