The “Data in Helmholtz” page
This page of the HMC FAIR Data Dashboard presents informative charts regarding data publications within the Helmholtz Association, with corresponding centre and research field identifiers. Additionally, it features a comprehensive sunburst plot, which illustrates average FAIR assessment scores.
With its focus on Helmholtz-specific filters for Helmholtz centers and -research fields, it is ideally suited for targeted explorations of the data by Helmholtz staff working in all kinds of professions, ranging from the management level, research data professionals, research data management staff, to researchers who are interested open- and FAIR data practices at their centres or in their respective Helmholtz-research fields.
Since version 3.0, the dashboard allows to display and filter for data publications linked to multiple Helmholtz centers, research fields, and repositories - including those data publications directly found in the library metadata.
Page Components
Filter component
The filter component offers a two-dimensional filter option, enabling comprehensive data analysis. The data may be filtered by centre, by research field, or by both, as illustrated in the following images:
No selected options


Attention: Both filters options chosen in this component are applied to all charts on this subpage of the dashboard.
Charts components
The present page contains three charts, each of which has been designed with a specific target user and a particular object in mind.
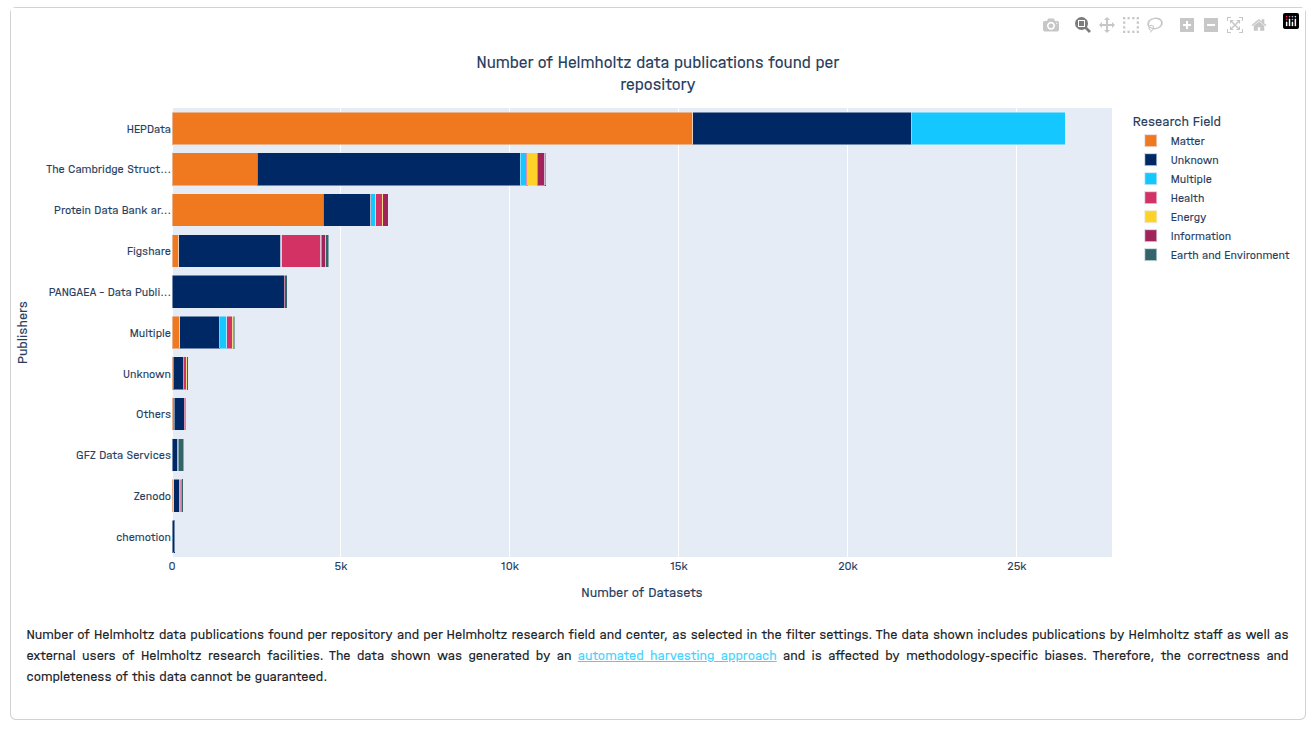
- Number of Helmholtz data publications found per repository
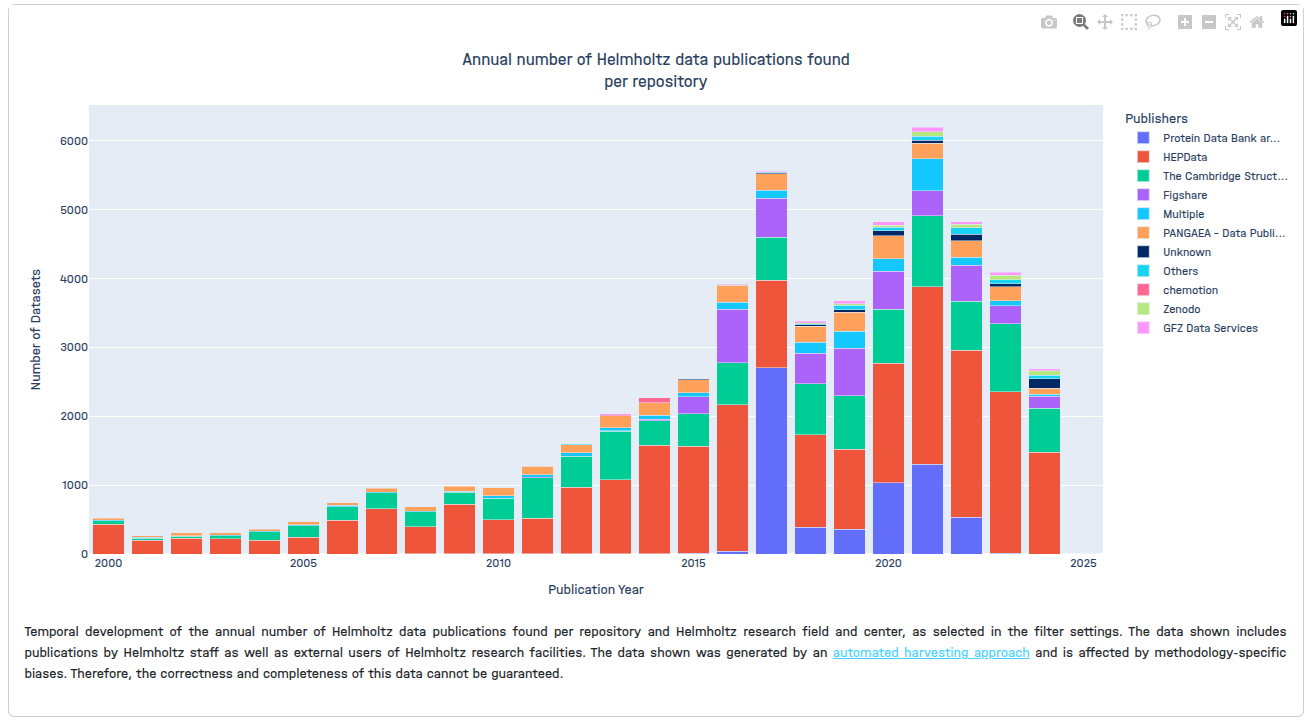
- Annual number of Helmholtz data publications found per repository
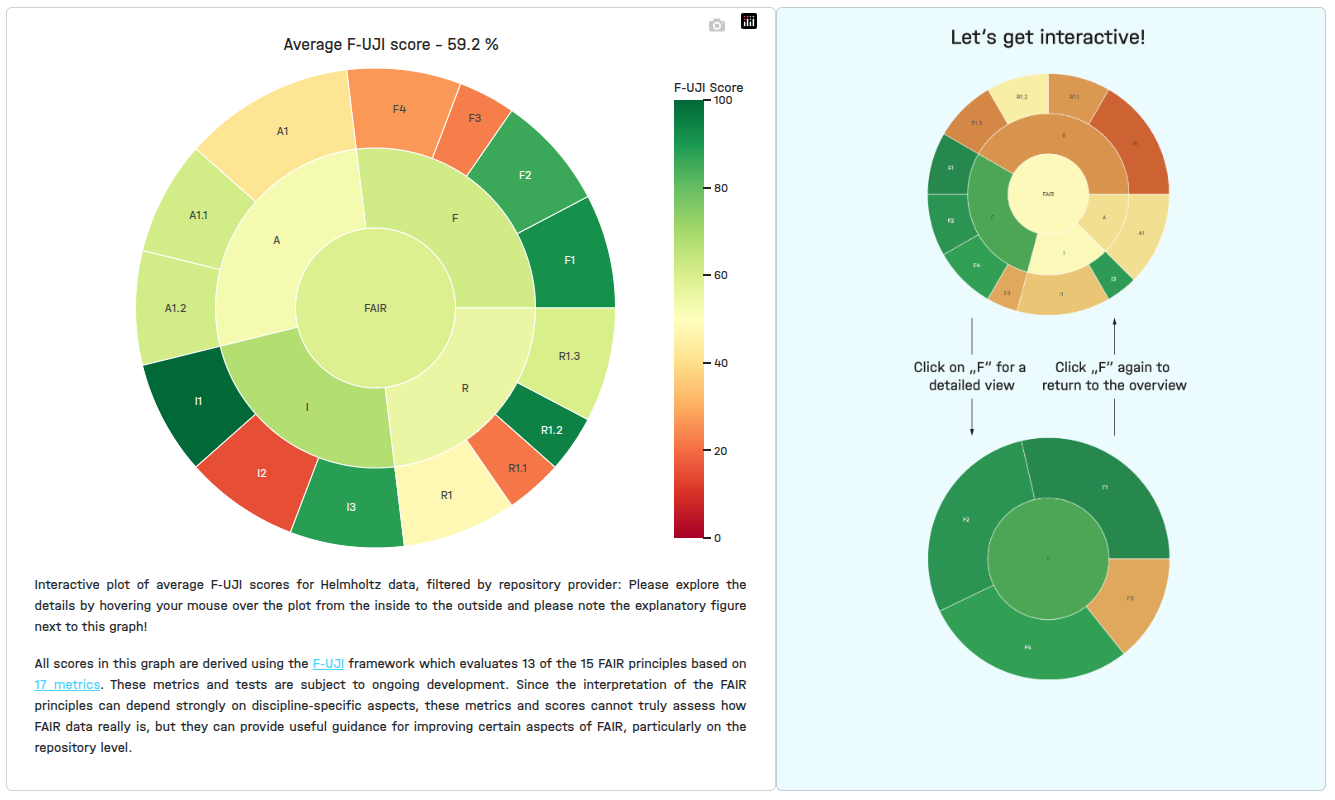
- Average F-UJI score
Directories and files
In regard to the aforementioned page, all relevant directories and files can be found in the following locations:
- bottom_info_box.py
- charts.py
- filter_options.py
- html_template.py
- db.py
- helper.py
- data_in_helmholtz.py
- data.de.yml
- data.en.yml
Challenges we faced
The achievement of a correct display of FAIR evaluation data in the sunburst plot at the bottom of this page required additional curation steps upon querying the data from the database.
Page data flow
The following five steps are currently being implemented in a generalised manner for this page.
- Query the data at once and process it for the page
- Copy and apply fillers on dataframe in a callback of the page
- Pass the final dataframe along the other required arguments to each chart function
- process the charts separately accordingly
- Return the gathered result from the callback
The following section presents a comprehensive overview of the essential steps for all plots, with a particular focus on the construction of the sunburst plot.
1. Query the data at once and process it for the page
In order to gain a deeper comprehension of the query procedure that we utilise, it is essential to initially familiarise oneself with the data model and storage of our documentation.
To the greatest extent feasible, we endeavor to utilize the queried data frame rather than querying the database on each page for the requisite data.
from .utility.db import data_is_supplemented_by_df as data_df


data_df = data_df[data_df["Publication Year"] >= 2000]
2. Copy and apply fillers on dataframe in callback of the page
The filtered data frame result was achieved through the utilisation of conditional operators, specifically the ‘if’, ‘elif’ and ‘else’. In accordance with the principles of logic, it can be deduced that there will be (N x N) cases, which, in this instance, equates to four.
A callback will be automatically triggered by Plotly Dash upon the loading of each page (at startup) or upon the occurrence of any alterations to the data in question.
@callback(
Output("graph_repository_usage", "figure"),
Output("graph_repository_usage_over_time", "figure"),
Output("graph_average_FAIR_score_sunburst", "figure"),
Output("filter_msg_data_in_helmholtz_page", component_property="style"),
Input("center_filter", "value"),
Input("research_field_filter", "value"),
Input("viewport_container", "data"),
)
def update_graph_research_data_helmholtz_figures(center, research_field, viewport_size):
    ...
and the data preparation and filtering logic is done as follows:
def get_filtered_data_frames(
    working_data_frame,
    center_value,
    research_field_value,
    is_filtered_center,
    is_filtered_rf,
):
    fair_data_frame = get_fair_scores_by_centers_research_field(working_data_frame)

    if not is_filtered_center and not is_filtered_rf:
        ...

    elif not is_filtered_center and is_filtered_rf:
        ...

    elif is_filtered_center and not is_filtered_rf:
        ...

    else:
        ...

    return filtered_data_frame, filtered_fair_data_frame
3. Pass the the final dataframe along the other required arguments to each chart functions
In this section, a single function is proposed for each chart, which is designed to address the chart logic.
  graph_repo_usage = graph_repository_usage(filtered_data_frame)
  graph_repo_over_time = graph_repository_usage_over_time(filtered_data_frame)
  graph_fair_sunburst = graph_average_fair_score_sunburst(filtered_fair_data_frame)
4. Process the charts separately accordingly
In this section, we provide a description of the sunburst plot, noting that the various chart functions are implemented in a manner that is distinct from one another.
def graph_average_fair_score_sunburst(filtered_fair):
return fair_sunburst(
    filtered_fair,
    i18n.t("data.graphAverageFAIRScoreSunburstTitle"),
    i18n.t("data.noFilterMatch"),
)
In order to generate a sunburst plot, it is necessary to have data in multi dimensions arrays or list of each values, such as
- Name
- Parent
- Value
- Score
- Value percent
each of them is gathered and stored accordingly.
INDEX_AVG_TOTAL = [...]
INDEX_AVG_SCORE = [...]
NAMES = [...]
PARENTS = [...]

def fair_sunburst(filtered_fair, title, no_data_found):
  ...

  score_values = filtered_df_fair.loc[INDEX_AVG_SCORE]["Avg FAIR"].round(1)
  weight_values = filtered_df_fair.loc[INDEX_AVG_TOTAL]["Avg FAIR"].round(1)
  weight_values_percentage = (weight_values * (100 / weight_values["Total FAIR"])).round(1)

  fig = px.sunburst(
    names=NAMES,
    parents=PARENTS,
    values=weight_values,
    color=score_values,
    branchvalues="total",
    custom_data=[weight_values_percentage],
    color_continuous_scale=px.colors.diverging.RdYlGn,
    template="seaborn",
    range_color=[0, 100],
    labels={"color": i18n.t("data.FujiScoreLabel")},
    hover_name=[
        i18n.t("data.AverageFAIR"),
        i18n.t("data.Findable"),
        i18n.t("data.F1"),
        i18n.t("data.F2"),
        i18n.t("data.F3"),
        i18n.t("data.F4"),
        i18n.t("data.Accessible"),
        i18n.t("data.A1"),
        i18n.t("data.A11"),
        i18n.t("data.A12"),
        i18n.t("data.Interoperable"),
        i18n.t("data.I1"),
        i18n.t("data.I2"),
        i18n.t("data.I3"),
        i18n.t("data.Reusable"),
        i18n.t("data.R1"),
        i18n.t("data.R11"),
        i18n.t("data.R12"),
        i18n.t("data.R13"),
    ],
)
...
5. Return the gathered result from the callback
Ultimately, the results of each function must be returned from the callback in order to facilitate the updating of the UI of each chart in accordance with the desired specifications.
 return (
        change_legend_according_viewport_size(
            graph_repository_usage_chart, viewport_size_width
        ),
        change_legend_according_viewport_size(
            graph_repository_usage_over_time_chart, viewport_size_width
        ),
        change_legend_according_viewport_size(
            graph_average_fair_score_sunburst_chart, viewport_size_width
        ),
        {"display": "block"} if is_filtered else {"display": "none"},
    )