The “FAIR by Repository” page
This subpage is designed as a repository-specific entry point to the data shown in this dashboard. It allows e.g. repository managers, data infrastructures and publishers to explore their target groups in Helmholtz, their development over time as well as averaged results resulting from an automated evaluation of Helmholtz data publications in their repository with respect to specific aspects of FAIR.
Since version 3.0, the dashboard allows to display and filter for data publications linked to multiple Helmholtz centers, research fields, and repositories - including those data publications directly found in the library metadata.
Page Components
Filter component
This component offers a filter option, enabling comprehensive data analysis. The data may be filtered by the name of the repository or publisher name, respectively, as illustrated in the following image:
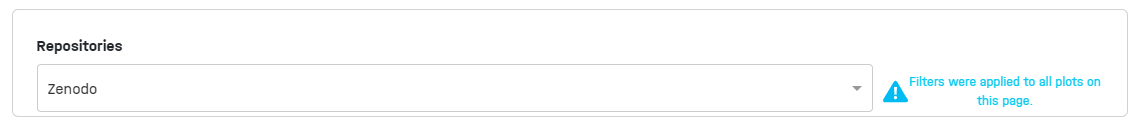
Attention: The filter option chosen in this component are applied to all charts on this subpage of the dashboard.
Charts components
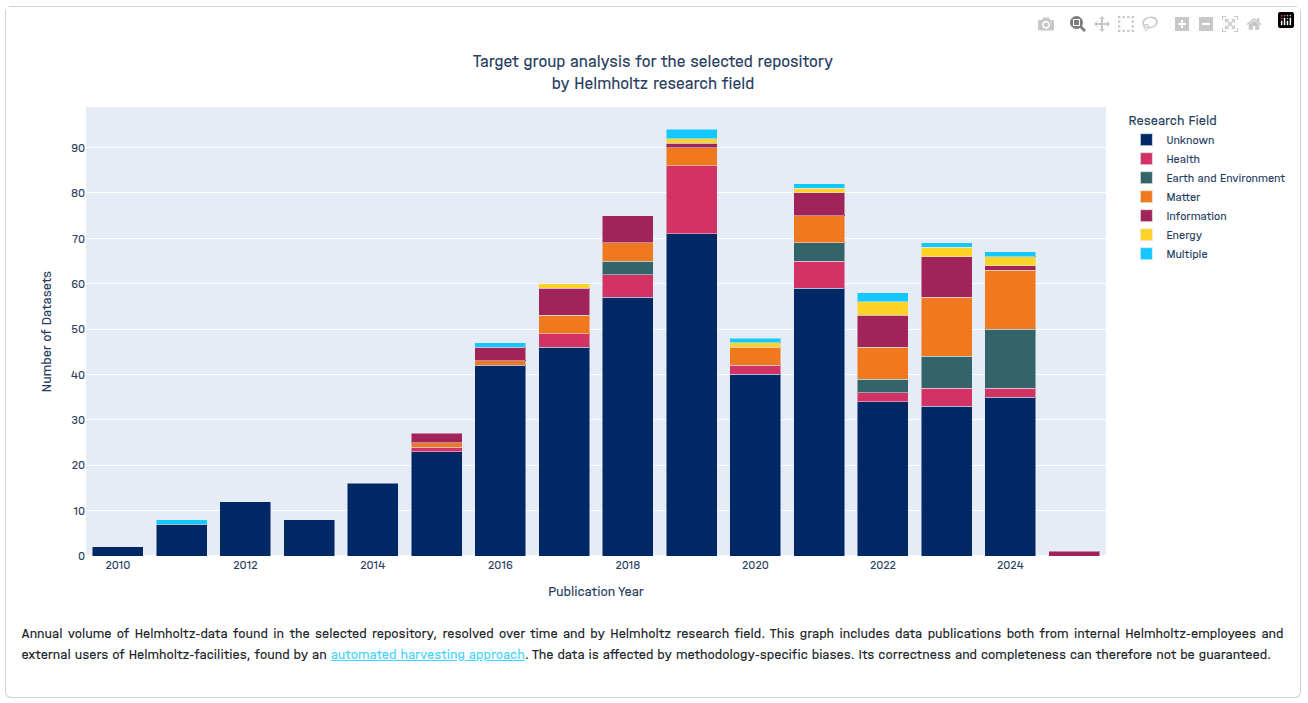
The current page comprises four charts, each of which has been designed with a specific target user and a particular object in mind.
- Target group analysis for the selected repository by Helmholtz research field
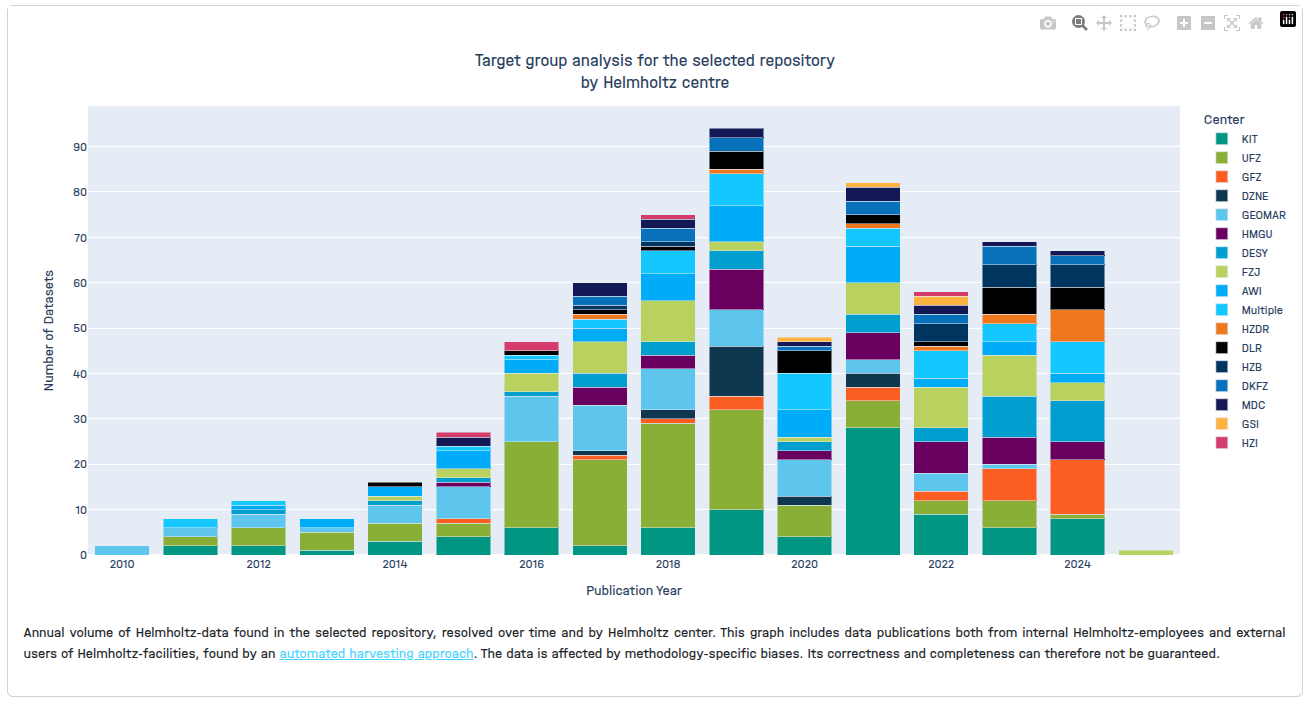
- Target group analysis for the selected repository by Helmholtz centre
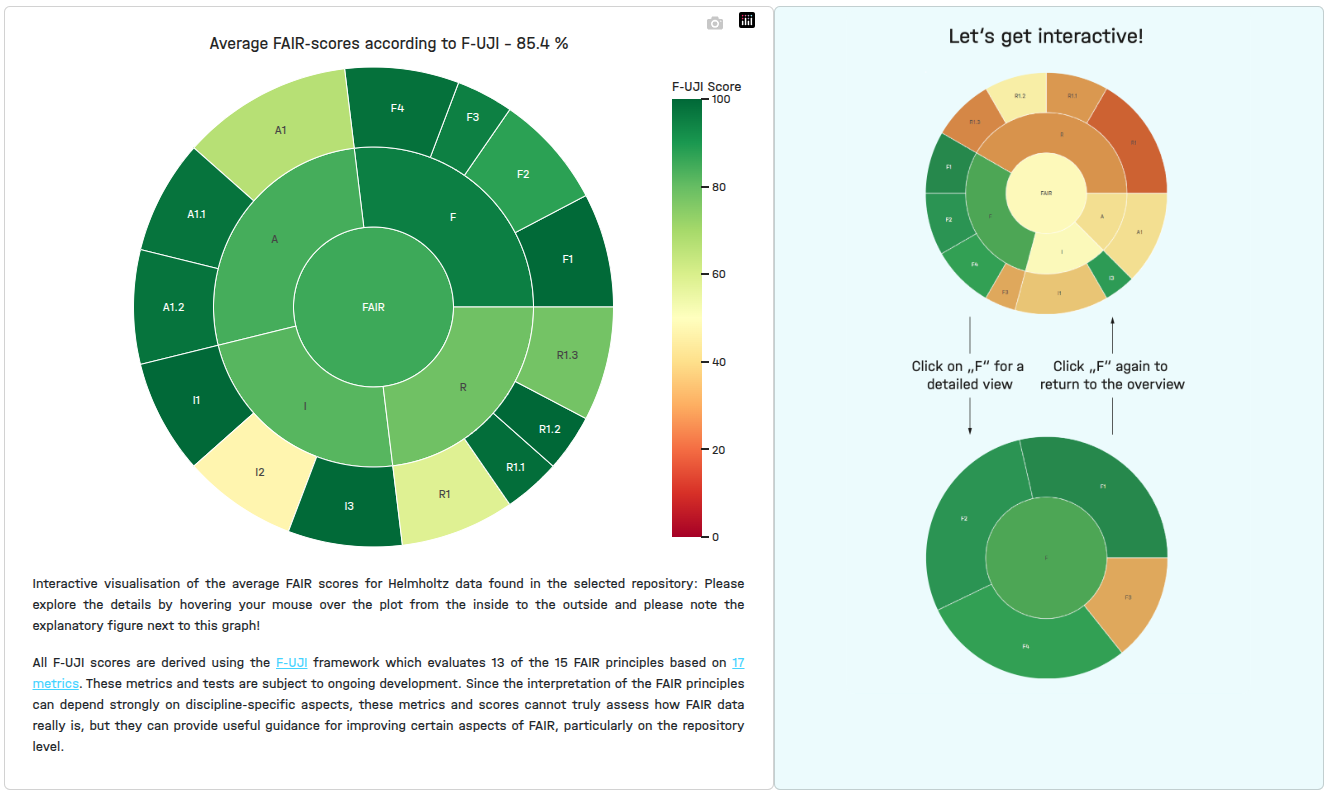
- Average FAIR-scores according to F-UJI
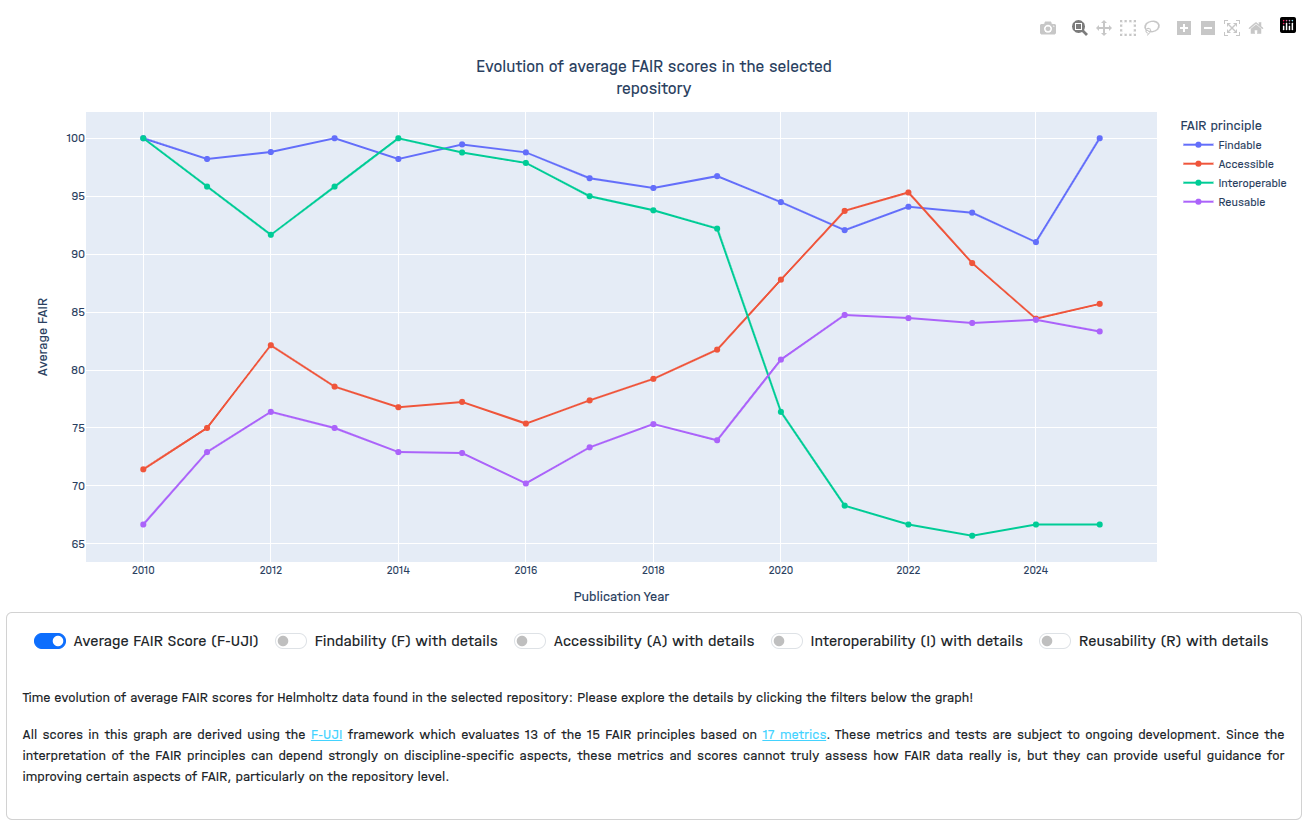
- Evolution of average FAIR scores in the selected repository
Directories and files
In regard to the aforementioned page, all relevant directories and files can be found in the following locations:
- bottom_info_box.py
- charts.py
- filter_options.py
- html_template.py
- db.py
- helper.py
- fair_by_repository.py
- repo.de.yml
- repo.en.yml
Challenges we faced
The most challenging aspect of this page was the sunburst plot and the general and details FAIRness chart for a selected repository, which required additional attention during the data gathering and processing stages. In order to achieve the desired result, some manual curation of data was necessary.
Page data flow
The following five steps are currently being implemented in a generalised manner for this page.
- Query the data at once and process it for the page
- Copy and apply fillers on dataframe in two callbacks of the page
- Pass the final dataframe along the other required arguments to each chart function
- process the charts separately accordingly
- Return the gathered result from the callbacks
The construction of details overview of the sunburst plot can be viewed on the part entitled ‘Page Data Flow of Data in Helmholtz’.
The following section presents a comprehensive overview of the essential steps for all plots, with a particular focus on the construction of the general and details FAIRness chart for a selected repository.
1. Query the data at once and process it for the page
In order to gain a deeper comprehension of the query procedure that we utilise, it is essential to initially familiarise oneself with the data model and storage of our documentation.
To the greatest extent feasible, we endeavor to utilize the queried data frame rather than querying the database on each page for the requisite data.
from .utility.db import data_is_supplemented_by_df as data_df


data_df = data_df[data_df["Publication Year"] >= 2000]
dataframe_rf = get_count_dataset_by_rf_repositories_center(data_df)
dataframe_fair = get_fair_scores_by_centers_research_field(data_df)
2. Copy and apply fillers on dataframe in callback of the page
This page contains two callback functions, reflecting the potential occurrence of two distinct sets of dynamic events.
- Selecting the repository from the filter option
- In addition of the filter option the changing the details FAIRness switch options for the general and details FAIRness chart for a selected repository
In this case, we have tried to group the charts that should be changed according to the event.
A callback will be automatically triggered by Plotly Dash upon the loading of each page (at startup) or upon the occurrence of any alterations to the data in question.
@callback(
Output("graph_research_field_in_repository", "figure"),
Output("graph_centers_in_repository", "figure"),
Output("graph_average_FAIR_score_sunburst_in_repository", "figure"),
Output("filter_msg_fair_by_repository_page", component_property="style"),
Input("repository_filter", "value"),
Input("viewport_container", "data"),
)
def update_graph_figures(repository, viewport_size):
...
and
@callback(
Output("graph_average_FAIR_score_line_in_repository", "figure"),
Input("repository_filter", "value"),
Input("fair_mode", "value"),
Input("viewport_container", "data"),
)
def update_graph_average_fair_score_figure(repository, fair_mode, viewport_size):
...
3. Pass the the final dataframe along the other required arguments to each chart functions
In this section, a single function is proposed for each chart, which is designed to address the chart logic.
    graph_research_field_in_repository_chart = graph_research_field_in_repository(filtered_df)
    graph_centers_in_repository_chart = graph_centers_in_repository(filtered_df)
graph_average_fair_score_sunburst_chart = graph_average_fair_score_sunburst(filtered_fair)graph_dataset_publication_fair_line_chart = graph_dataset_publication_fair_line(
filtered_fair, fair_mode
)
4. Process the charts separately accordingly
In this section, we provide a description of the general and details plot, noting that the various chart functions are implemented in a manner that is distinct from one another. To achieve the desired result, we had checked the fair_mode value and plotted the graph accordingly.
def graph_dataset_publication_fair_line(filtered_fair, fair_mode):
if fair_mode == "fair":
    ...
elif fair_mode == "f":
    ...
elif fair_mode == "a":
    ...
elif fair_mode == "i":
    ...
elif fair_mode == "r":
    ...
5. Return the gathered result from the callbacks
Ultimately, the results of each function must be returned from the callbacks in order to facilitate the updating of the UI of each chart in accordance with the desired specifications.
return (
    change_legend_according_viewport_size(
        graph_research_field_in_repository_chart, viewport_size_width
    ),
    change_legend_according_viewport_size(
        graph_centers_in_repository_chart, viewport_size_width
    ),
    change_legend_according_viewport_size(
        graph_average_fair_score_sunburst_chart, viewport_size_width
    ),
    {"display": "block"} if is_filtered else {"display": "none"},
    )
return change_legend_according_viewport_size(
    graph_dataset_publication_fair_line_chart, viewport_size_width
)