The “Welcome” page
This page serves as a landing page and informs the reader on fundamental concepts considered in this dashboard as well as its scope. In high level figures, it offers an overview of literature- and data publications of the Helmholtz Association, included in this dashboard.
Page Components
General numbers component
The page includes a general statistics component, which provides information on the total number of gathered literature- and data publications, the Helmholtz centres connected to this dashboard and the date when the database was last updated. This is illustrated in the following diagram.
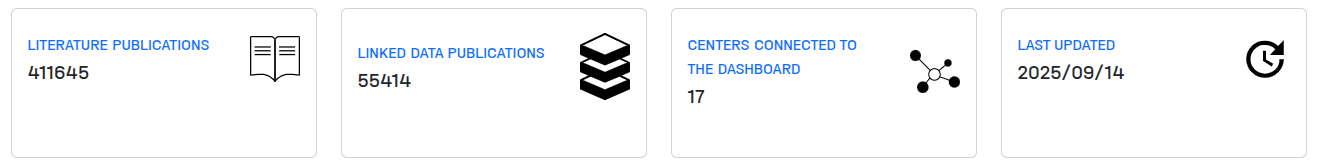
In this composition, each number is queried separately from the database in accordance with the specifications outlined in the following SQL queries.
Total number of literature publications
SELECT p.publication_year as 'Publication Year',
p.`type` as 'Publication Type', COUNT(DISTINCT p.id) as 'Total Number of Literatures'
FROM publication AS p
INNER JOIN center_has_publication AS pc ON p.id = pc.publication_id
INNER JOIN center AS c ON pc.center_id = c.id
WHERE p.`type` = 'Literature' AND p.publication_year >= 2000 AND p.publication_year <= %s
GROUP BY p.publication_year
ORDER BY p.publication_year
Total number of data publications
SELECT p.publication_year as 'Publication Year',
 p.`type` as 'Publication Type', COUNT(DISTINCT p.id) as 'Total Number of Datasets'
FROM publication AS p
INNER JOIN reference AS r ON p.id = r.reference_to_id
INNER JOIN publication AS pr ON pr.id = r.reference_id
INNER JOIN center_has_publication AS pc ON pr.id = pc.publication_id
INNER JOIN center AS c ON pc.center_id = c.id
WHERE p.`type` = 'Dataset' AND  r.`sub_type` = 'IsSupplementedBy'  AND  p.publication_year >= 2000
AND p.publication_year <= %s
GROUP BY p.publication_year
ORDER BY p.publication_year
Total number of connected centers
SELECT id as ID, name as Name, description as Description FROM center ORDER BY name ASC
Date on which the database was last updated
SELECT MIN(last_updated) as min_last_updated_info, MAX(last_updated)
as max_last_updated_info FROM publication
Overview chart of literature- and data publications
The general overview chart of literature and data publication in Helmholtz illustrates the total number of publications over time, as demonstrated in the chart below.
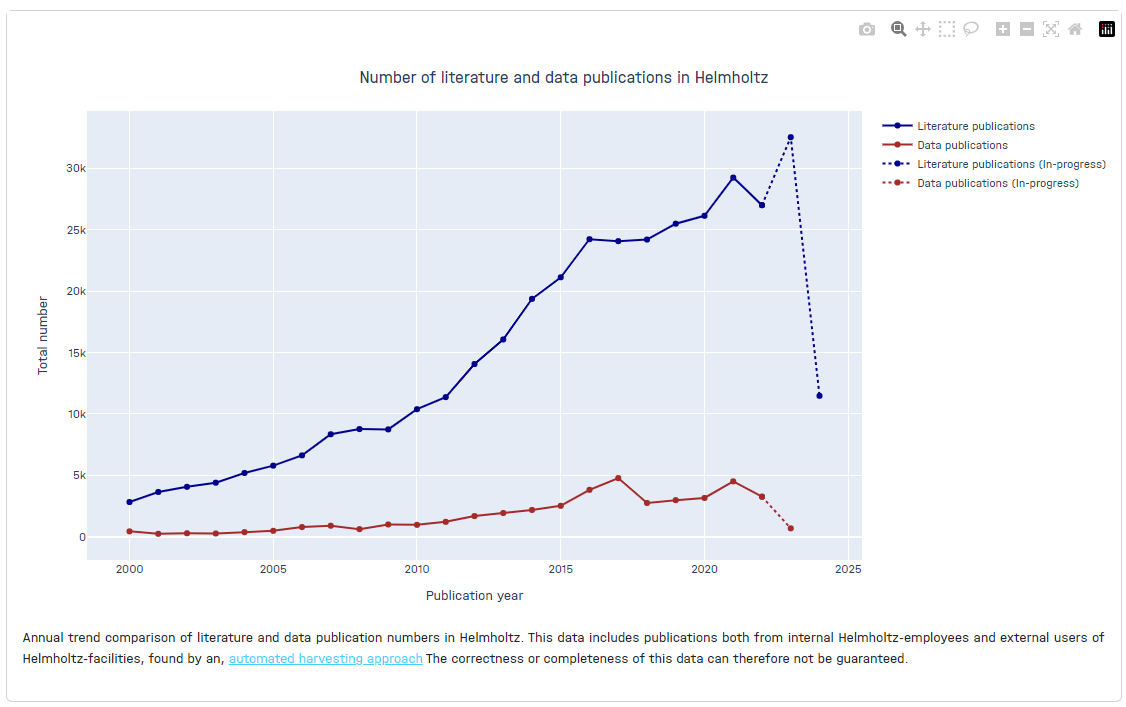
In order to generate this chart, the combination of two previously queried data (Total number of literatures , Total number of datasets) from the database was used, with additional processing of the data to achieve the desired result.
Directories and files
In regard to the aforementioned page, all relevant directories and files can be found in the following locations:
- bottom_info_box.py
- charts.py
- home_number.py
- db.py
- helper.py
- home.py
- home.de.yml
- home.en.yml
Challenges we faced
In the process of developing this page, the following challenges have emerged.
Responsiveness on different devices
We received feedback on variable responsiveness of the charts on various devices. We now ensure that charts on all pages of the dashboard are as responsive as possible for small screen devices. This is detailled in section Responsiveness of the charts of this documentation.
Visualization of publication numbers that are “work in progress”
User feedback showed a lack of understanding for why the last 2-3 years in the data show lower publications numbers than the years before. This is due to the time it requires different stakeholders to make publications and publication metadata available. To visually highlight this “work-in-progress” status, we connect the datapoints for the last two years with dashed lines, while all other data points are connected with solid lines.
Technically, data therefore needs to be queried in a different way, resulting in the separation of the general data frame into two distinct subsets.
The first subset, encompasses data points from the minimum year (2000 in our dashboard case) to the specified (N year as OLD_MAX_YEAR) , while the second subset, comprises data points from the specified (N year OLD_MAX_YEAR) to the (current year as labelled “MAX_YEAR”).
This was applied to both the dataset data frame and the literature data frame. Subsequently, the processed data were integrated into the chart through the utilisation of the add_traces() function within the Plotly framework.
The parameters OLD_MAX_YEAR and MAX_YEAR may be configured within the .env file. In the source code this is implemented in the following way:
MAX_YEAR = int(os.environ.get("MAX_YEAR", "2024"))
OLD_MAX_YEAR = int(os.environ.get("OLD_MAX_YEAR", "2022"))

...

literature_for_join_df = literature_count_df[
    ["Publication Type", "Publication Year", "Total Number of Literatures"]
].copy()

data_for_join_df = data_df[
    ["Publication Type", "Publication Year", "Total Number of Datasets"]
].copy()

result = pd.merge(
    literature_for_join_df, data_for_join_df, on="Publication Year", how="outer"
)

result[["Total Number of Datasets", "Total Number of Literatures"]] = result[
    ["Total Number of Datasets", "Total Number of Literatures"]
].astype(float)

old_years_result = result[result["Publication Year"] <= OLD_MAX_YEAR]
current_year_result = result[
    (result["Publication Year"] >= OLD_MAX_YEAR)
    & (result["Publication Year"] <= MAX_YEAR)
]

...

fig1 = go.Figure()
fig1.add_traces(
    go.Scatter(
        name=i18n.t("home.totalNumberLiterature"),
        x=old_years_result["Publication Year"],
        y=old_years_result["Total Number of Literatures"],
    )
)

...

fig1.add_traces(
    go.Scatter(
        name=i18n.t("home.totalNumberDatasets"),
        x=old_years_result["Publication Year"],
        y=old_years_result["Total Number of Datasets"],
    )
)

...

fig1.add_traces(
    go.Scatter(
        name=i18n.t("home.totalNumberLiteratureInProgress"),
        x=current_year_result["Publication Year"],
        y=current_year_result["Total Number of Literatures"],
    )
)

...

fig1.add_traces(
    go.Scatter(
        name=i18n.t("home.totalNumberDatasetsInProgress"),
        x=current_year_result["Publication Year"],
        y=current_year_result["Total Number of Datasets"],
    )
)